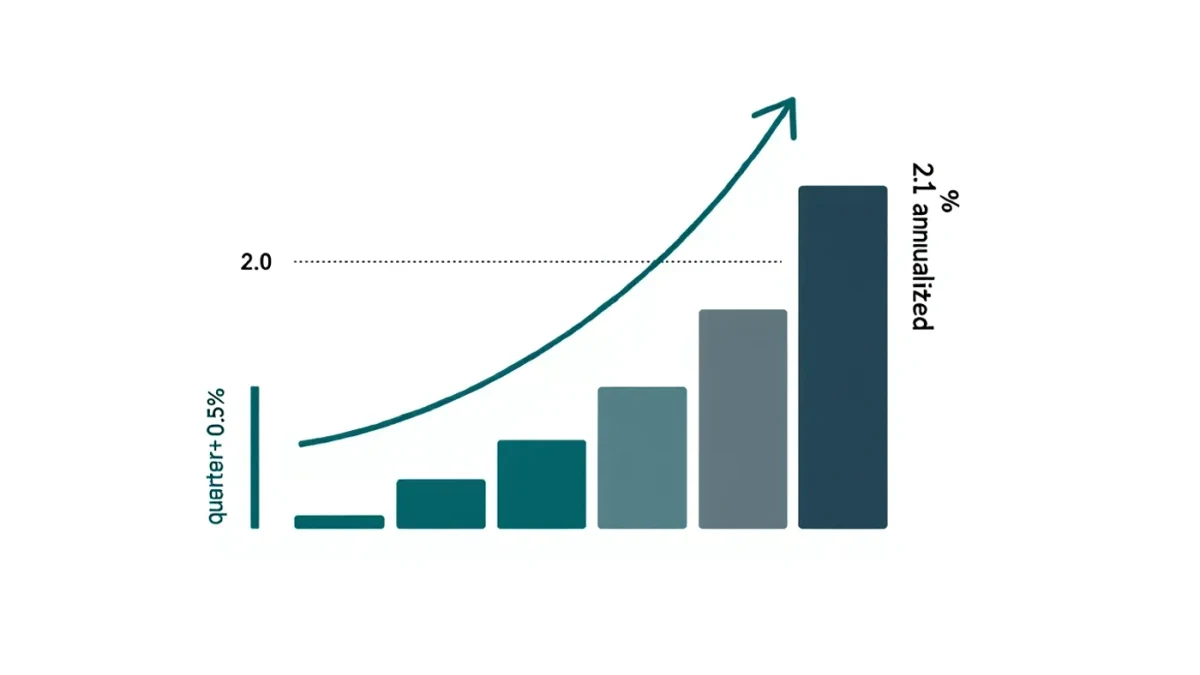
GDP — gross domestic product — is the total value of everything the country produces in a period, and the quarterly report expresses it as an annualized growth rate: how fast the economy would grow for a full year if the quarter's pace continued. The first quarter of 2026 came in at a 2.1% annualized rate in the Bureau of Economic Analysis advance estimate published April 30 — moderate growth, below 2025's stronger quarters but well clear of contraction. Each release lands three times per quarter — advance, second, and third estimates — and revisions are routine, which is the first thing a careful reader learns to expect.
SAMCASH publishes information, not financial advice — macro data informs context, and personal decisions ride on your own income, debts, and timeline.
What is actually in the number?
Four buckets: consumer spending (about two-thirds of the total), business investment, government spending, and net exports. The consumer is the engine — when household spending holds, recessions rarely arrive, which is why the spending line gets read more closely than the headline. One mechanical wrinkle trips new readers: changes in inventories and trade can swing a single quarter's print without saying much about underlying demand — imports rising ahead of tariffs shaved measured growth in past quarters for exactly this bookkeeping reason, and economists strip those effects out when judging momentum.
Why annualized rates confuse people
Because 2.1% annualized is not 2.1% that quarter — it is about 0.5% in the quarter itself, compounded up to a yearly pace. The convention amplifies small quarterly moves into dramatic headlines: a 1.5% annualized quarter is roughly 0.4% actual output growth, and a negative annualized print can still be a positive quarter's arithmetic smoothed badly. When you compare GDP numbers across reports, keep the convention constant — annualized versus quarter-over-quarter is the classic apples-to-oranges error.
How does GDP reach your money?
Through jobs and rates. Sustained growth above roughly 2% tends to hold unemployment low and wages firm; sustained prints near zero raise layoff risk — and gross domestic income, GDP's less-famous twin measured from paychecks rather than production, often signals labor softening first. The Federal Reserve watches the same numbers: strong growth with high inflation keeps rates elevated, as in the 2025–2026 holding pattern at 3.50%–3.75%, while weakening growth is what earns cuts. Your savings APY and your job market both price off that reaction function.
| Annualized print | What it usually signals | Household read |
|---|---|---|
| 3%+ | Strong expansion | Job market firm; inflation watch on |
| 1.5–3% | Moderate growth (Q1 2026: 2.1%) | Steady as she goes |
| 0–1.5% | Stalling | Recession chatter begins |
| Negative, two quarters | Contraction | Job risk real; recession checklist out |
What does GDP not tell you?
Distribution and wellbeing. GDP counts spending, not who benefits — output can rise while median wages stagnate, and it rises after disasters as rebuilding counts as production. It misses unpaid work and says nothing about debt accumulation behind consumption. And it is a rearview report: the advance estimate describes a quarter that ended a month before publication, revised twice more after that. Treat it as the economy's quarterly physical — informative about direction, silent about your particular diagnosis.
How should you actually use the release?
Three habits suffice for households. Read the consumer spending line before the headline — it is the recession predictor that matters. Track the direction across quarters rather than reacting to single prints, because revisions average out over time. And connect the print to rate expectations: a growth slowdown is usually the path to mortgage relief via Fed cuts, which is why bad GDP news and good refinancing news are often the same announcement.
FAQ
Is two negative quarters automatically a recession?
It is the informal shorthand, not the definition — the NBER's committee weighs jobs, income, and breadth, and has both missed the shorthand and ignored it, as in 2022. Two down quarters are a strong warning sign, not the official seal.
Why does the number change after release?
The BEA publishes three estimates per quarter as more complete data arrives — import documents, quarterly earnings, tax filings. Revisions of a few tenths of a point are routine; occasionally they flip the sign, which is why the third estimate is the one historians cite.
Which matters more, GDP or the jobs report?
For households, the jobs report — it is monthly, fresher, and more directly tied to paychecks and the Fed's employment mandate. GDP frames the year; the jobs report frames the month.