Treasury yields are the annual interest rates the US government pays to borrow money for set terms — a few weeks out to 30 years — and they are the closest thing finance has to a public thermometer. The 10-year Treasury yield in particular anchors mortgage pricing: lenders price 30-year home loans as a spread above it, so when the 10-year falls, mortgage rates usually follow within days. Unlike the Federal Reserve's overnight rate, set by committee, Treasury yields are set daily by global buyers and sellers betting real money on growth and inflation.
SAMCASH publishes information, not financial advice — yields describe market conditions, and borrowing or investing decisions depend on your own situation.
What is a yield, in plain terms?
The yearly return a buyer earns for lending the government a given amount. Buy a note at face value with a 4% coupon and hold it and you earn 4% a year. Yields quoted in the news are for newly issued securities, and they move inversely to price: when demand pushes a bond's price up, its yield drops, and vice versa. So a falling yield means buyers are paying more for the safety of Treasuries; a rising yield means they are demanding more interest to hold them.
Why does the 10-year matter most?
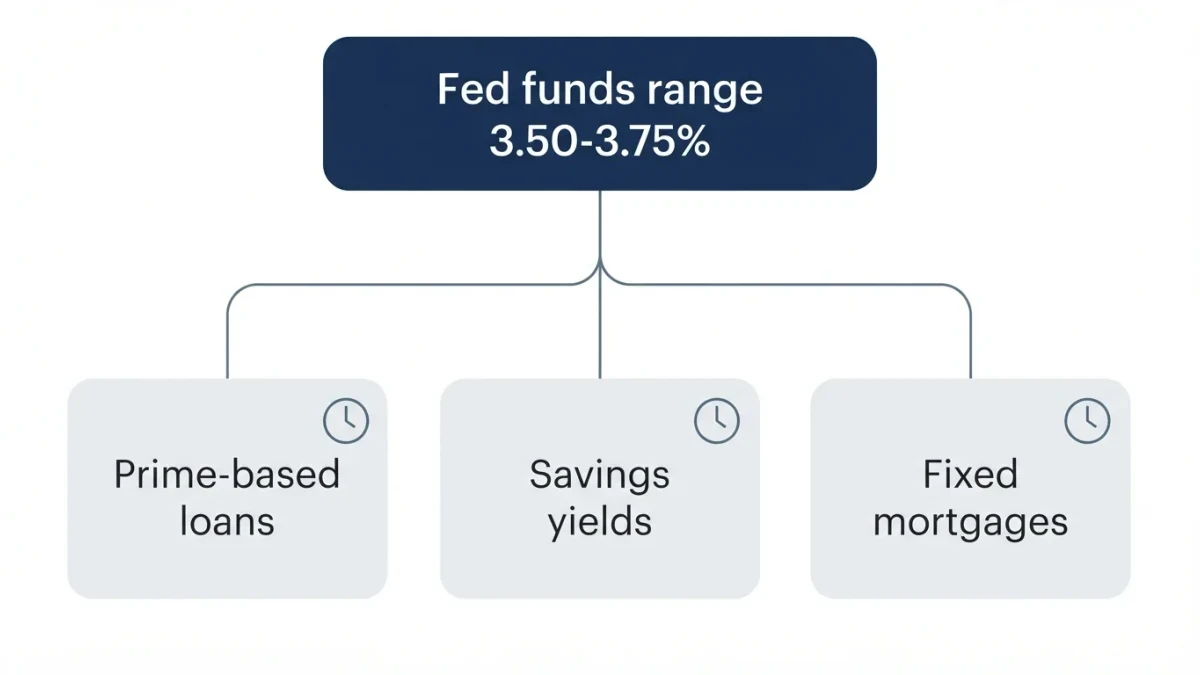
Because it prices the money behind long-term lending. Mortgage rates, corporate bond rates, car-loan pricing, and even the discount rate on a business's future profits all key off the 10-year. In 2025 and 2026 this split produced a pattern worth knowing: the Federal Reserve cut its overnight range to 3.50%–3.75% by December 2025, yet 30-year mortgage rates stayed well above overnight rates, because they answer to the 10-year — which markets kept elevated while inflation and federal borrowing needs pressed on the long end.
What is the yield curve telling you?
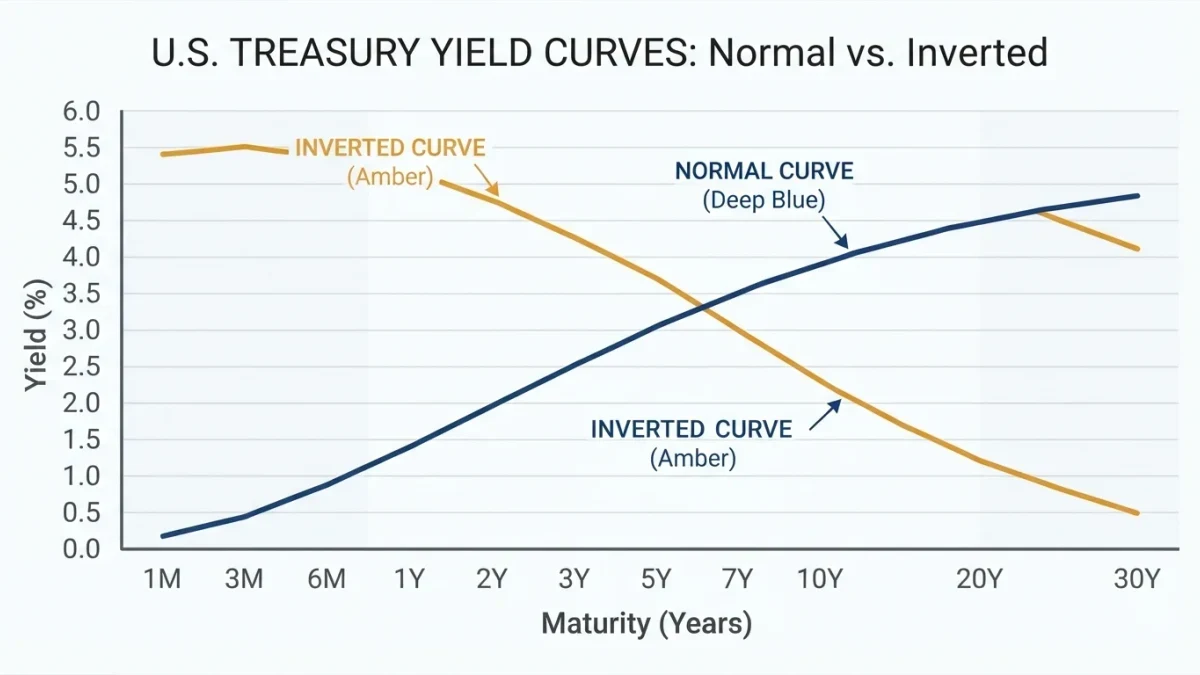
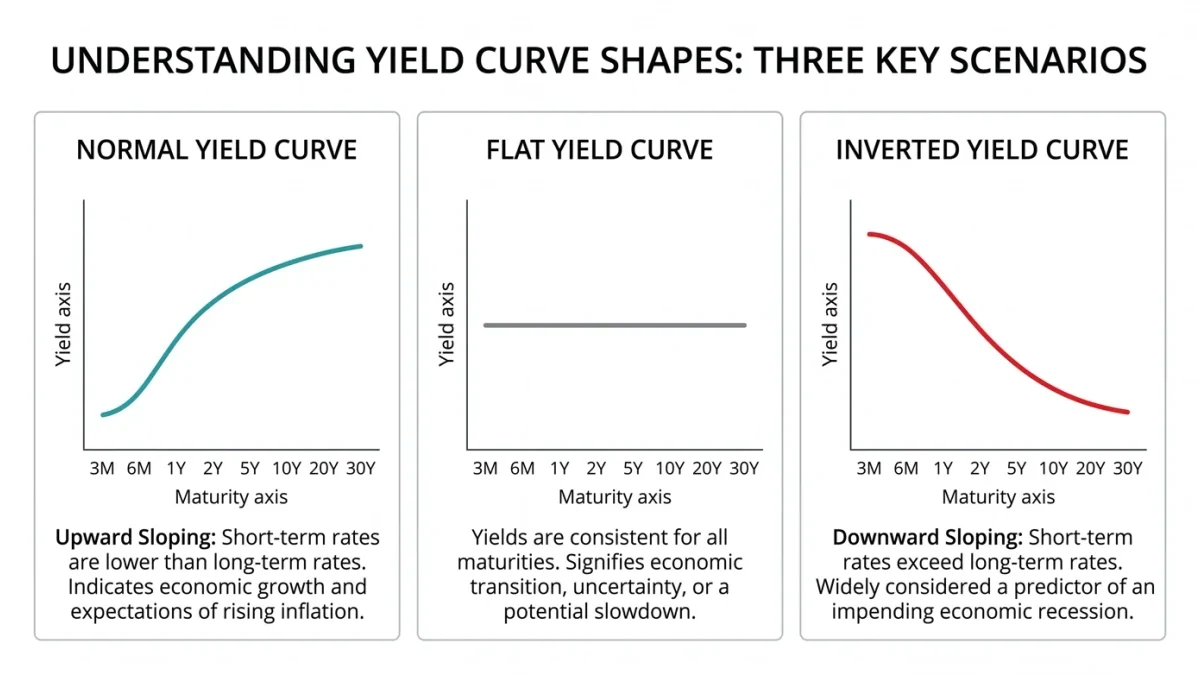
The shape formed by short versus long yields is the market's growth forecast. Normally long-term yields sit above short-term ones — lenders earn more for locking money up longer. When short-term yields rise above long-term ones, the curve is inverted, which historically has preceded recessions because it says markets expect the Fed will have to cut rates to rescue a slowing economy. The gap between the 3-month and 10-year is the classic gauge; economists watch it because its inversions have preceded most modern US recessions, with a lag of up to two years and occasional false alarms.
| Yield signal | What the market expects | What it often means for you |
|---|---|---|
| 10-year falling | Slower growth, lower inflation | Mortgage and refi rates drift down |
| 10-year rising | Stronger growth or more inflation | Mortgage rates climb, bond funds dip |
| Curve inverted | Rate cuts ahead to fight weakness | Recession odds elevated — defensive time |
| Curve normalized | Cuts arriving or done | Historically near turning points |
How should a regular household use this?
As timing context, not a trading system. Watching the 10-year before locking a mortgage can identify better weeks to lock — rates follow it with a short lag. Before a bond-fund purchase, remember that existing bond funds fall when yields rise, so long-term bond funds carry real price risk in a rising-yield year. And when headlines celebrate an inverted curve normalizing, note that the improvement has often arrived close to recessions, not after them — the signal rewards caution, not celebration.
Can I buy Treasuries directly?
Yes — TreasuryDirect sells bills, notes, and bonds at auction in $100 increments, the same instrument the yields describe. Brokerages offer the same securities with easier resale. Buying them is a saving decision, not a yield bet, but knowing the on-ramp makes the numbers feel less abstract.
FAQ
Are Treasury yields the same as the Fed's rate?
No. The Fed sets the overnight range directly; yields on 2- to 30-year Treasuries come from market auctions. They interact — Fed moves pull short yields strongly — but the long end can move opposite the Fed, as it did while the Fed cut and mortgages barely budged.
Where can I check yields myself?
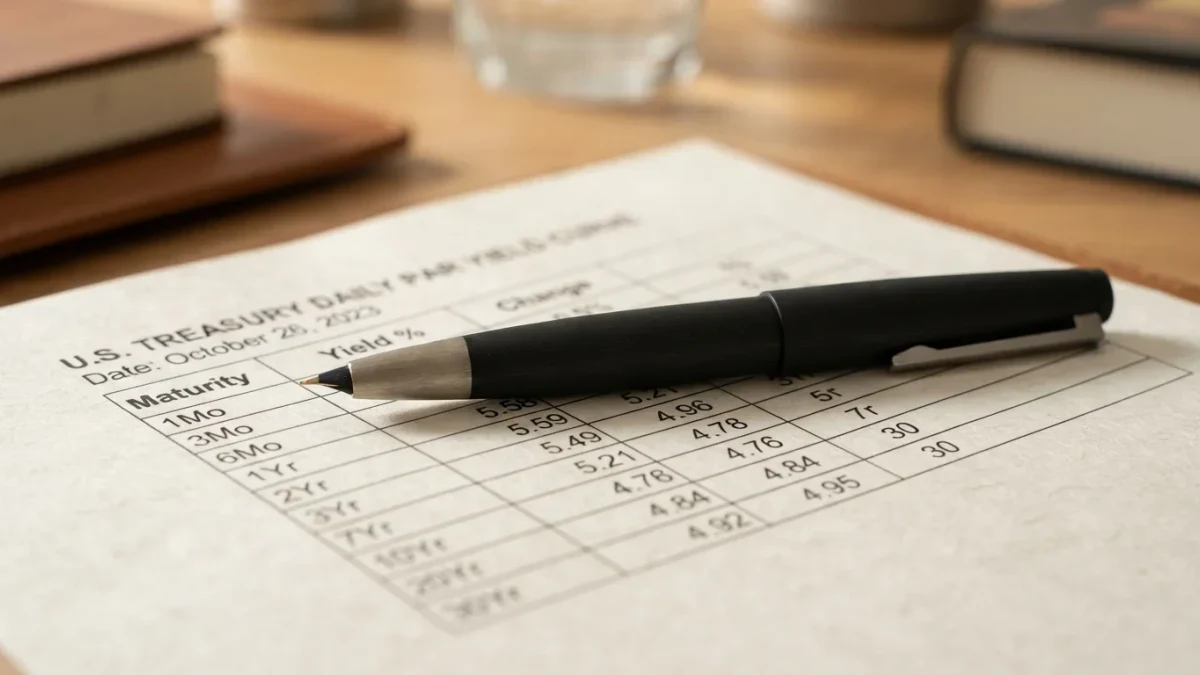
The Treasury Department publishes daily yield-curve data on its website, updated each trading evening, and financial news sites chart the same numbers. Watching the 3-month and 10-year series over months shows curve shape changes that matter.
Do higher yields help or hurt savers?
Both. New money in Treasuries, CDs, and savings-linked products earns more, but existing bond funds fall in price, and anyone borrowing long-term — chiefly homebuyers — pays more. The same number is a tailwind and a headwind depending on which side of the loan you sit.